Audience: event organisers and client administrators. Applies to: all plans.
Narrow a report down to the people or rows you need, put them in order, and count them in a chart. Filters, the sort order and the chart are saved with the report, so its exports, scheduled emails and dashboard widgets show the same rows.
Before you start
- You need a saved report. See Build a report.
- The filters on offer depend on the report's data source. An attendee report has status, registration type, date and name filters; a Product sales report also has Order status; a Session attendance report has Session.
Filter and sort the report
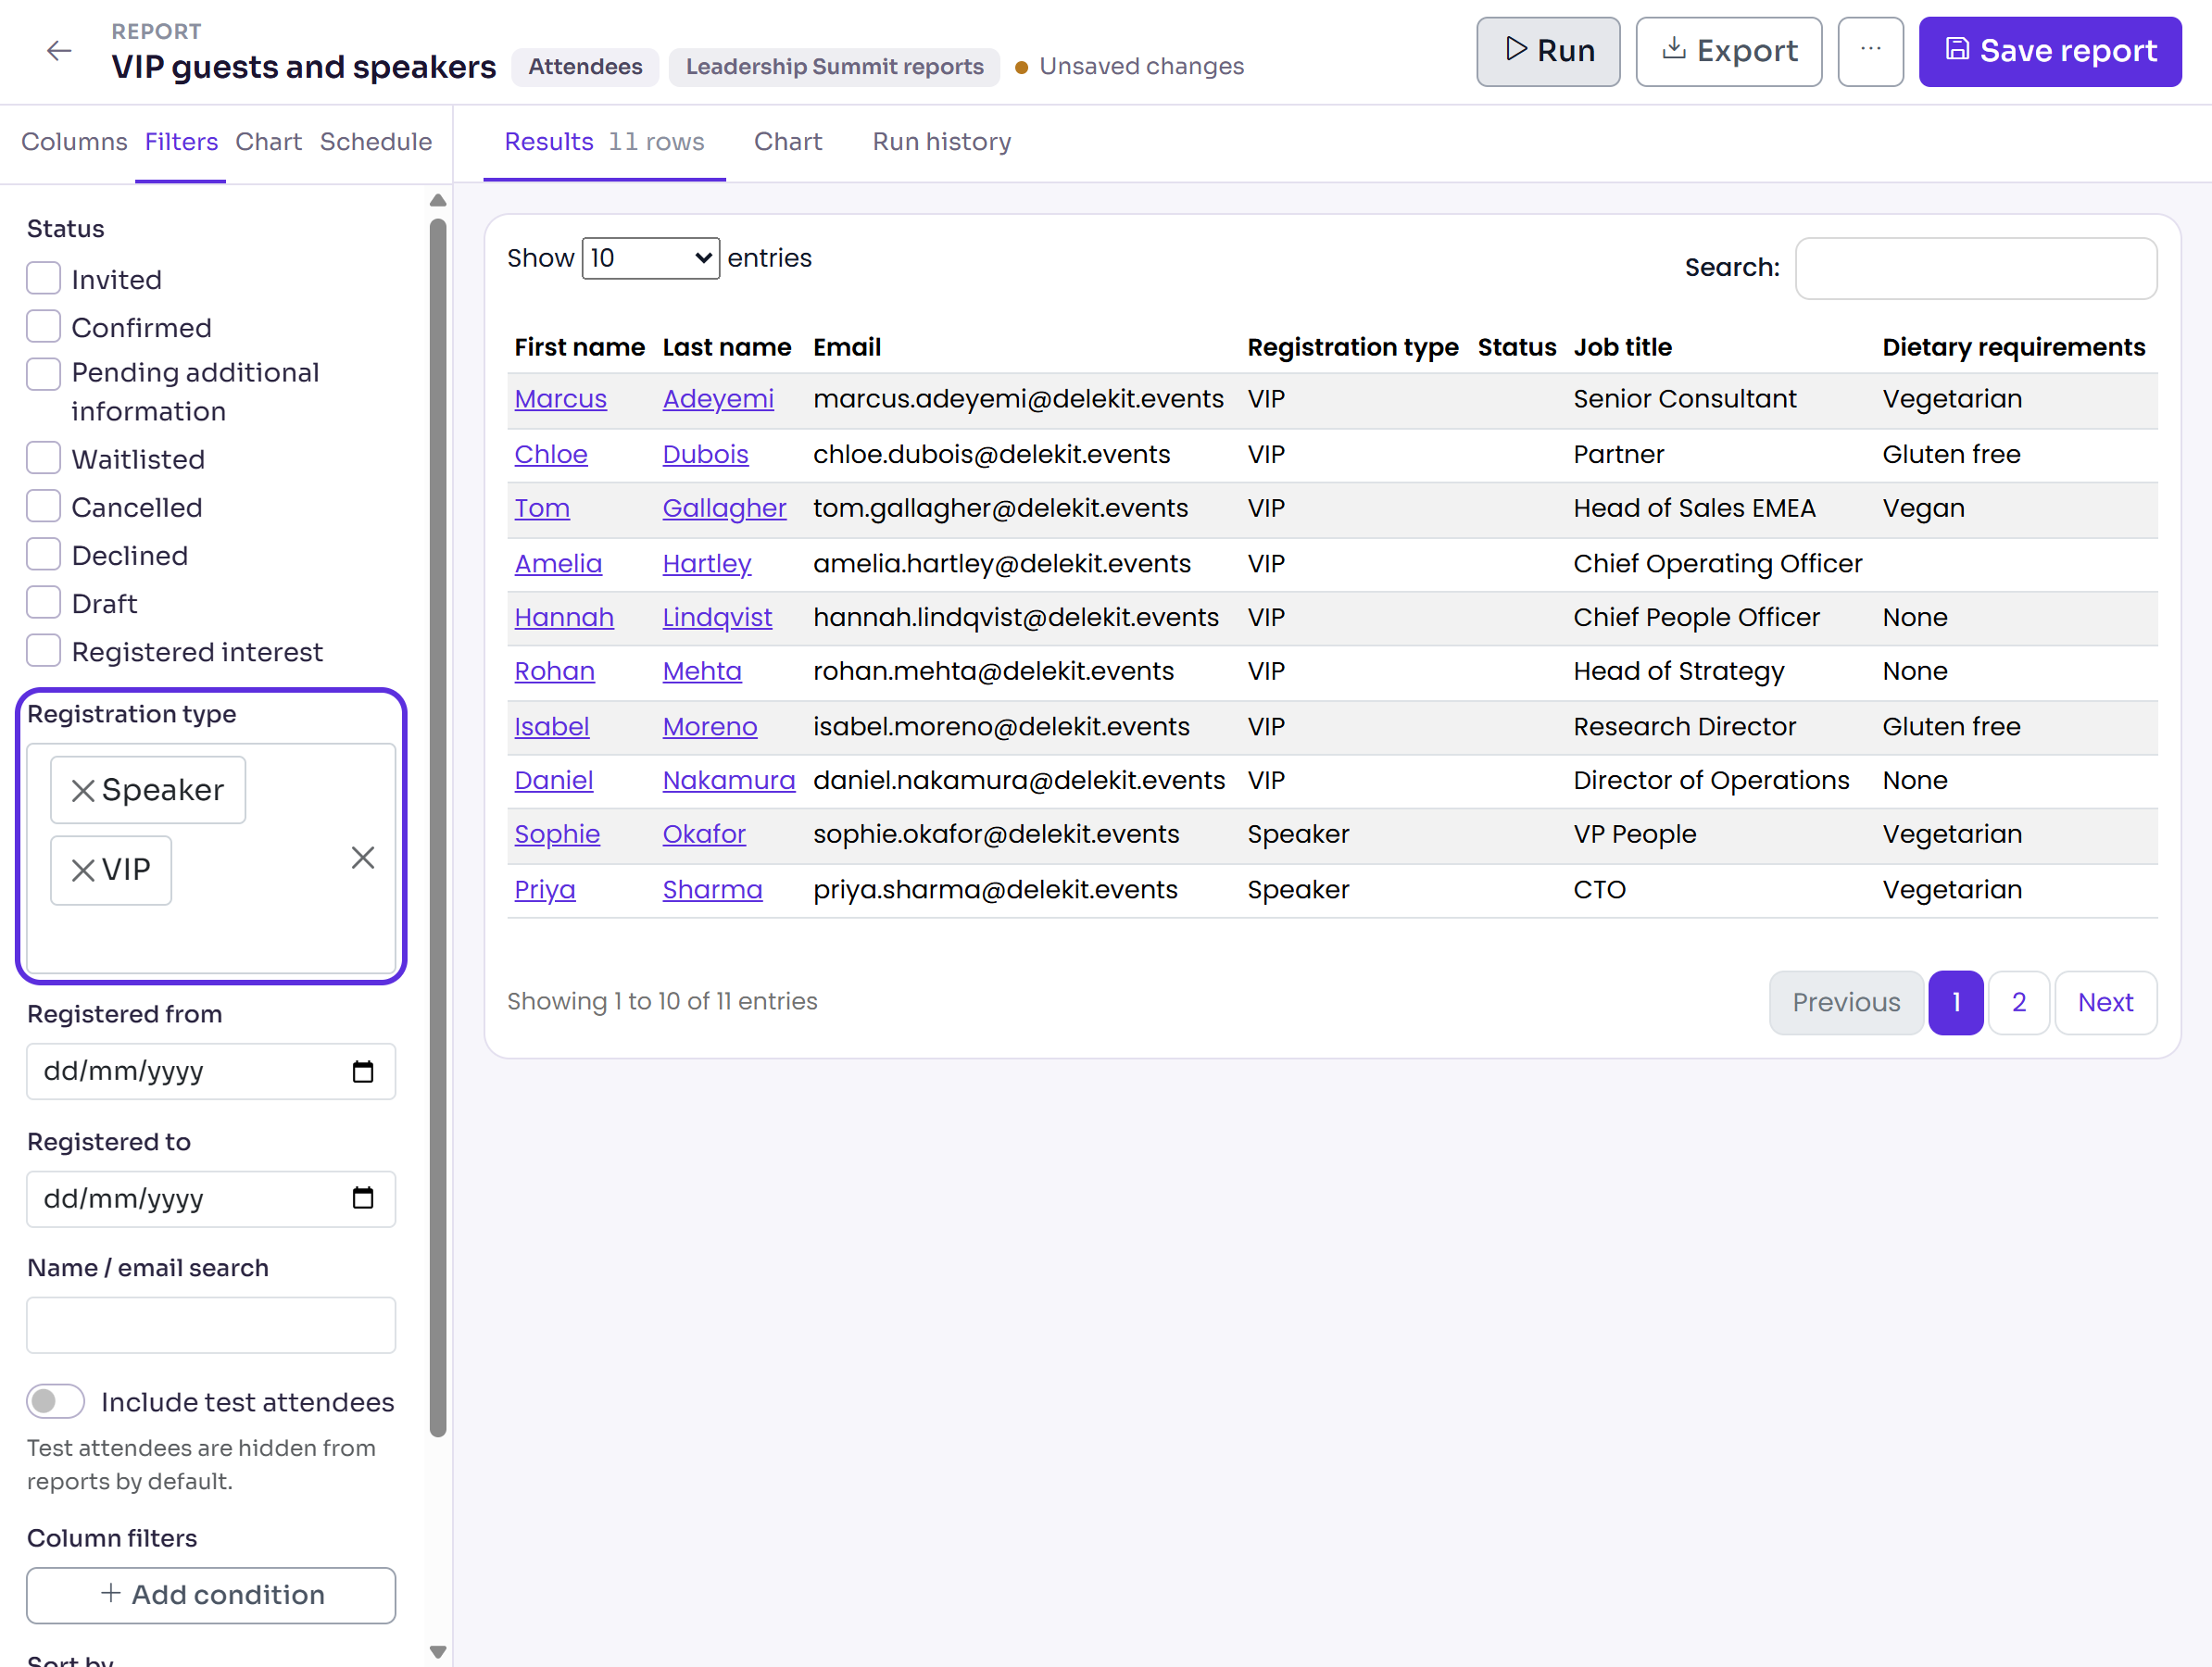
Open the report from Insights › Reports, then select the Filters tab.
Choose the filters you need:
- Status: tick the statuses to include, such as Invited or Pending additional information. With none ticked, every status is included.
- Registration type: choose one or more types. Left empty, all types are included.
- Registered from and Registered to: on an attendee report, the day the attendee's registration was confirmed, in the event's time zone. Other data sources name their own date, such as Booked from on a Session attendance report, Ordered from or Changed from.
- Name / email search: part of a name or email address.
- Include test attendees: turn on to include them. They're left out by default.
To filter on any column, select Add condition under Column filters. Choose the column, the condition (such as Contains, Is one of or Is empty) and the value. For each further condition, choose AND or OR.
In Sort by, choose a column, and in Order, choose A → Z or Z → A.
Select Run to preview the result. The number of rows shows next to Results.
Select Save report.
Add a chart to the report
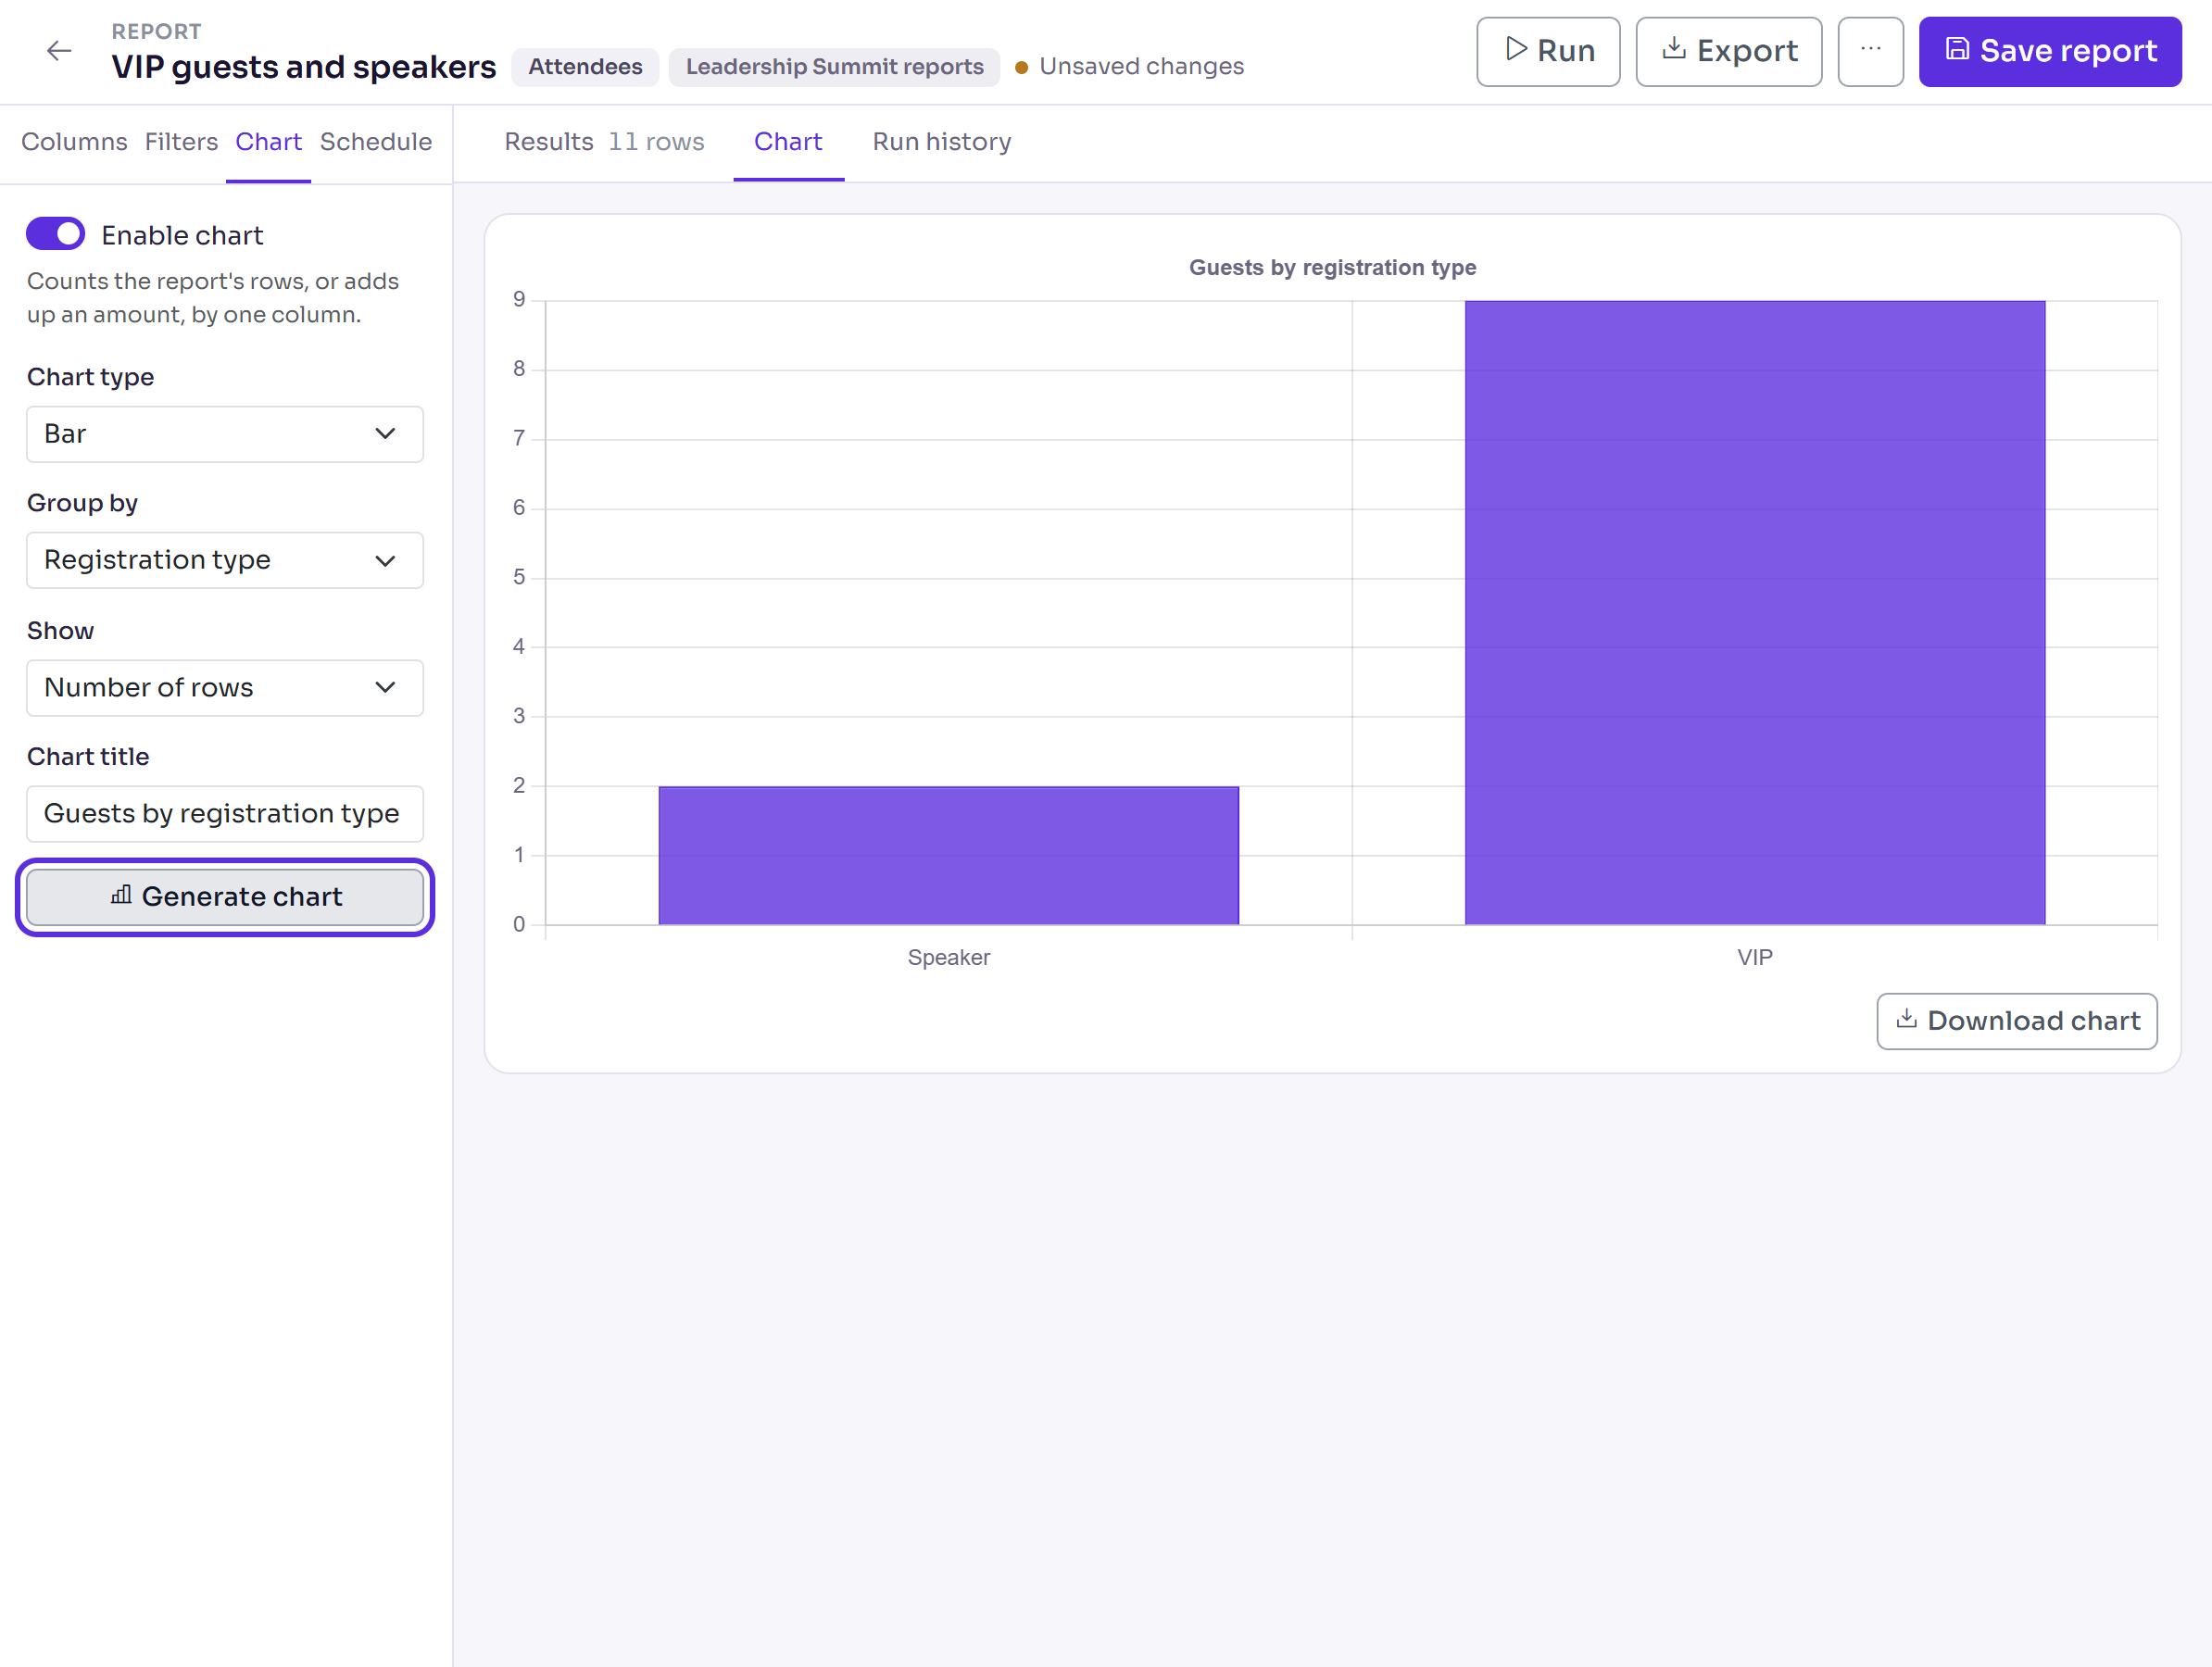
Select the Chart tab and turn on Enable chart.
Choose the Chart type: Bar, Line or Pie.
In Group by, choose the column to count by, such as Registration type, Status or one of your custom fields.
In Show, leave Number of rows, or choose a Total of option (such as a ticket value) to add up that amount instead.
Enter a Chart title if you want one, then select Generate chart. The chart opens under Chart.
Select Save report to keep the chart's settings.
To save the chart as a picture, select Download chart. It downloads as a PNG file.
What happens next
- An export or scheduled email of the report holds only the rows that match its saved filters, in its saved order. The chart isn't included in them.
- After you change a filter, select Generate chart again to redraw the chart.
Check it works
Change one filter, select Run, and check the row count next to Results changes as you expect. Then select Save report, open the report again, and check your filters and chart settings are still there.
If something isn't right
- "No results match the current filters." Remove filters until rows come back.
- The chart counts a different number of rows from the preview: select Generate chart again. The chart uses the filters and column filters as they were when it was drawn.
- Someone is missing: check Include test attendees, and that their status is ticked under Status. Deleted attendees are never in a report.
Related articles
- Build a report
- Export a report to Excel or CSV
- Attendee statuses explained
- Test a registration before you go live
Still stuck? Contact Delekit support.
Was this article helpful?
That’s Great!
Thank you for your feedback
Sorry! We couldn't be helpful
Thank you for your feedback
Feedback sent
We appreciate your effort and will try to fix the article