Audience: event organisers and client administrators. Applies to: all plans.
Build a report to list the people, bookings or sales of an event with exactly the columns you need. You choose what the report is built from, give it a name and a folder, then pick its columns in the report builder and save it. A saved report always shows the event's latest data, so you can open it again at any time, export it or email it on a schedule.
Before you start
- Anyone with access to the event can build reports, and everyone with access to it sees the event's reports.
- Decide what the report is about. The Data source is chosen when you build the report and can't be changed afterwards. To report on something else, build another report.
| Data source | One row for each |
|---|---|
| Attendees | attendee, with their custom fields |
| Session attendance | session booking, with the attendee's details and custom fields |
| Audit trail | change made to an attendee's details |
| Product sales | ticket sold, or order line with no tickets |
| Registration journey | step someone took through public registration |
| Unfinished registrations | person who gave their details and didn't finish registering |
Build the report
In the menu, select Insights, then Reports.
Select Build a report.
Choose the Data source, and enter a Report name.
In Folder, choose a folder, leave it Unfiled, or choose New folder… and enter a New folder name.
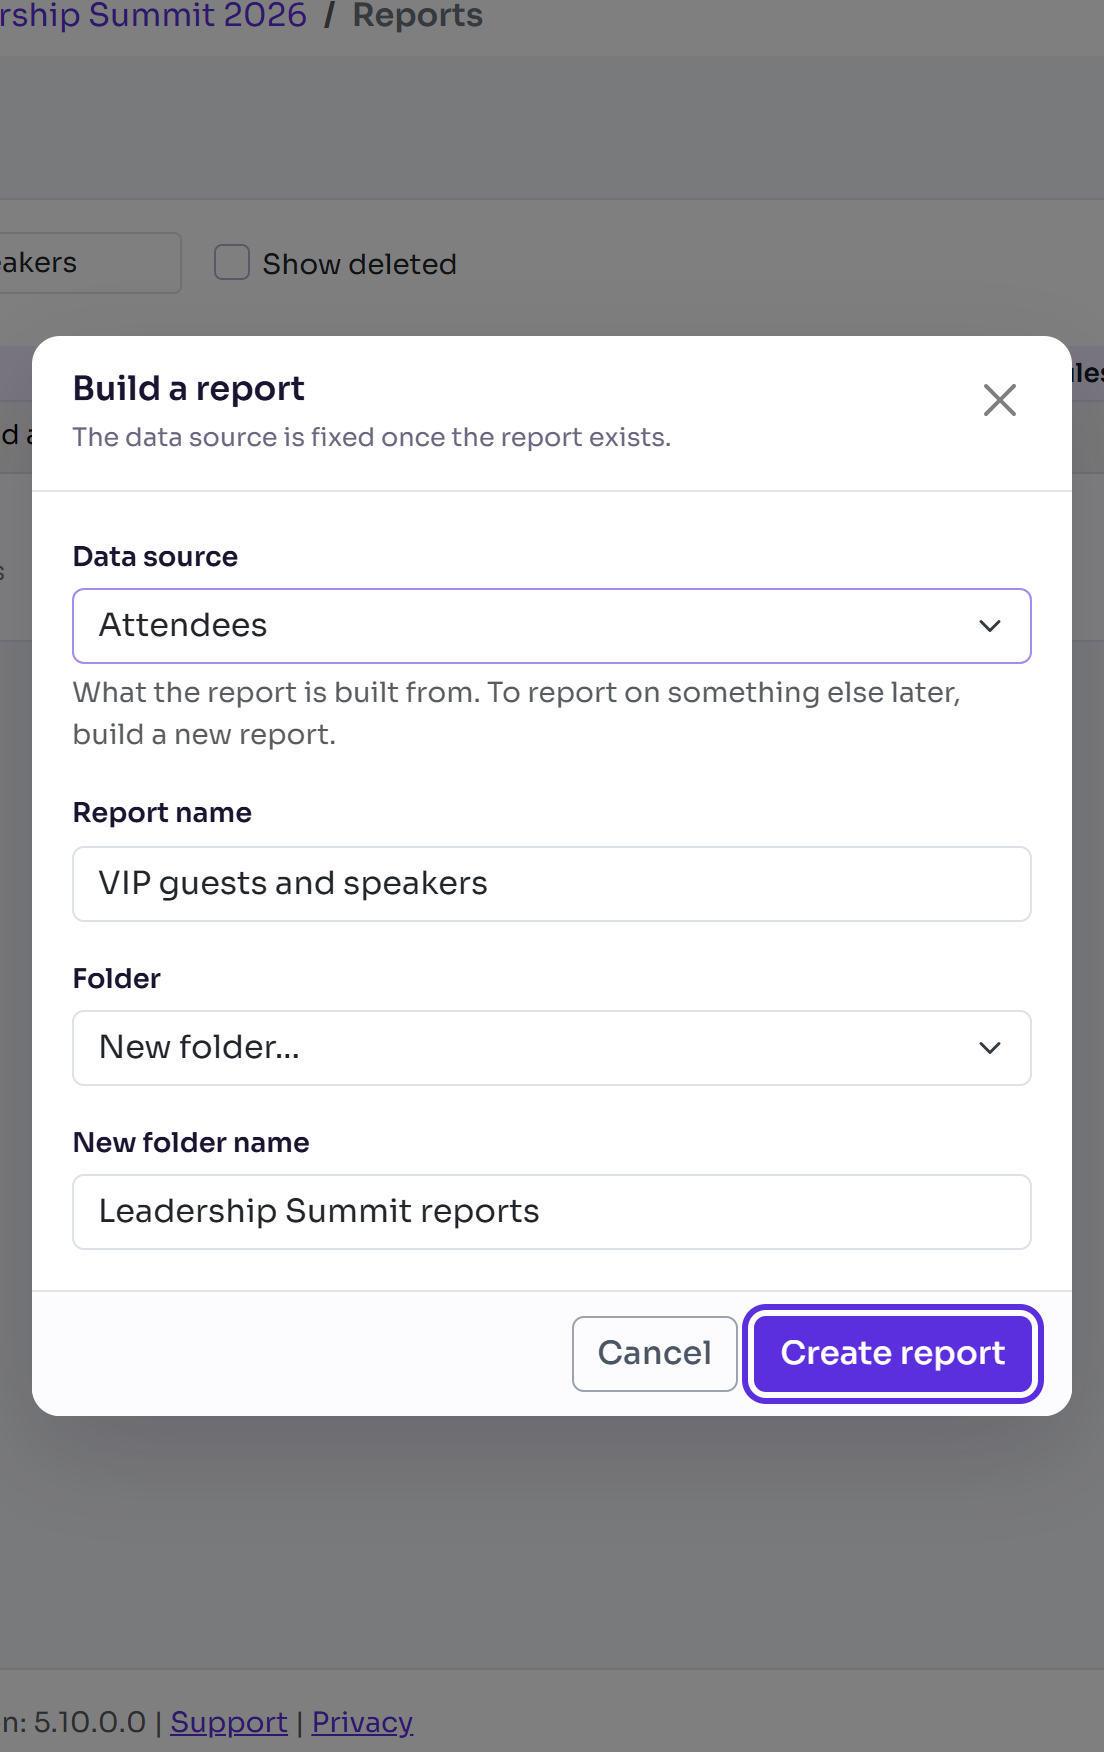
Select Create report. The report builder opens with "Report created. Choose its columns and filters, then save."
On the Columns tab, select + next to each field you want, in the order you want them. Search fields finds a field by name, and custom fields are listed under Custom fields. The preview under Results runs as you add them.
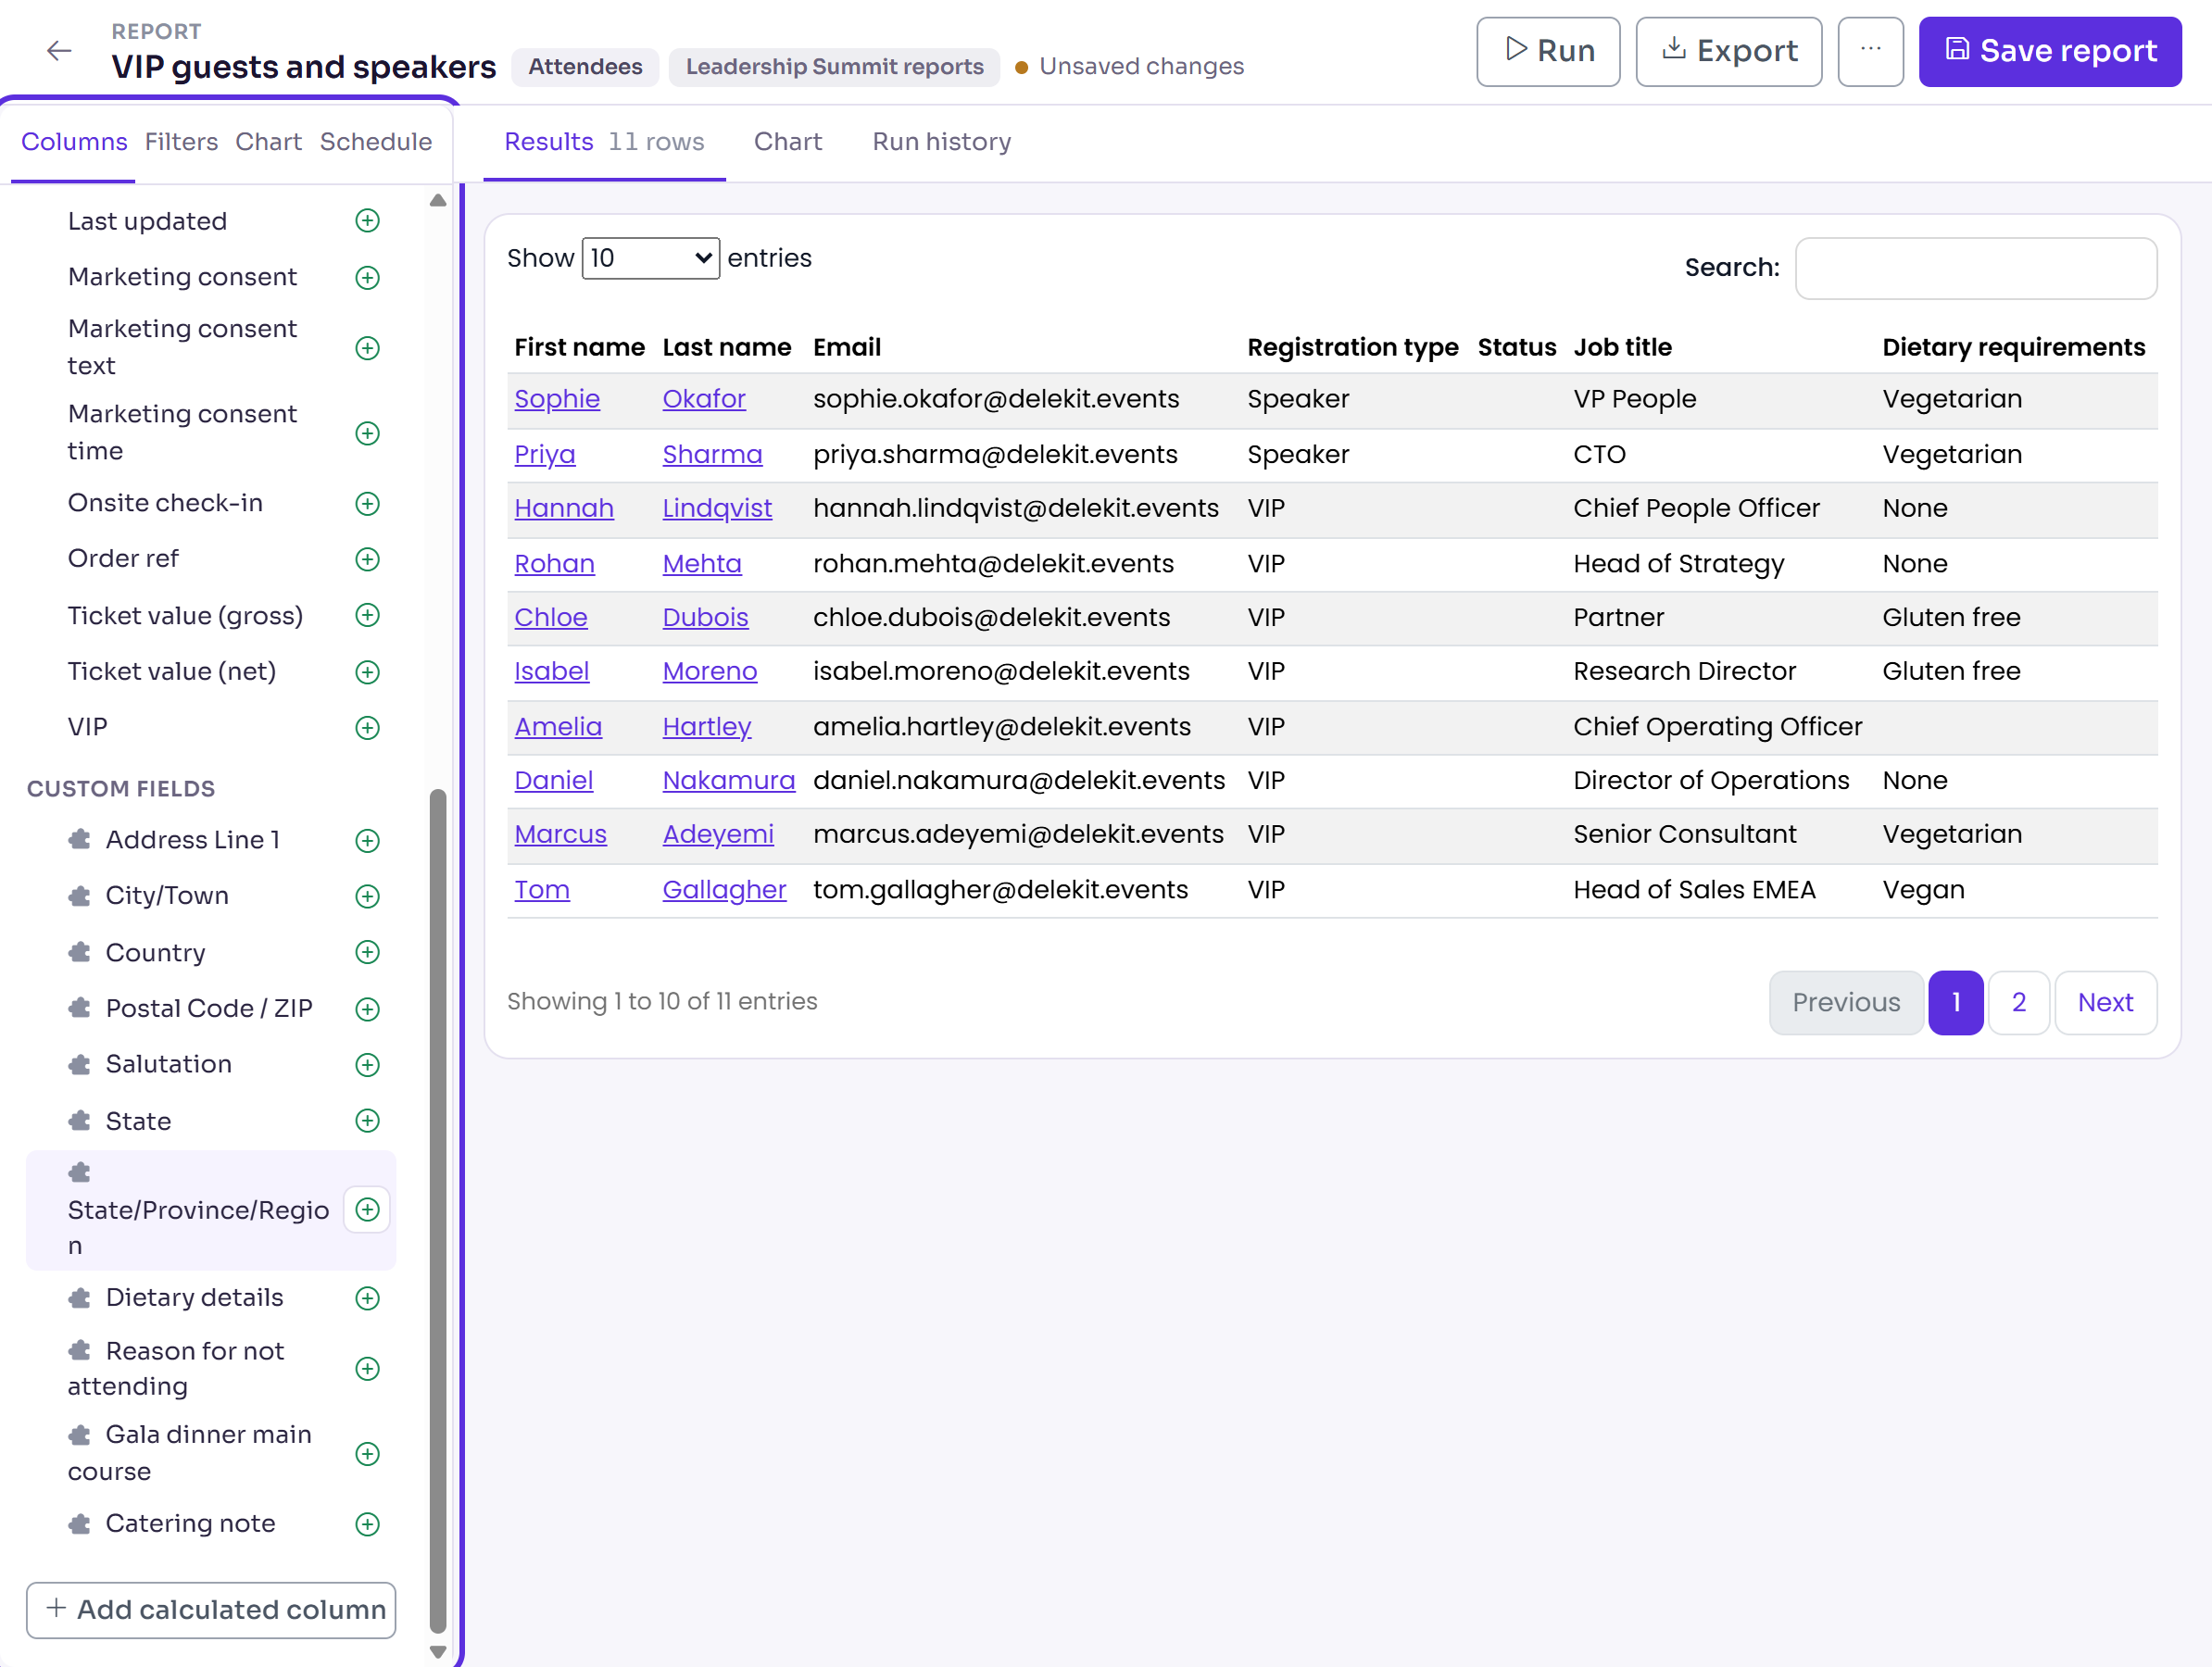
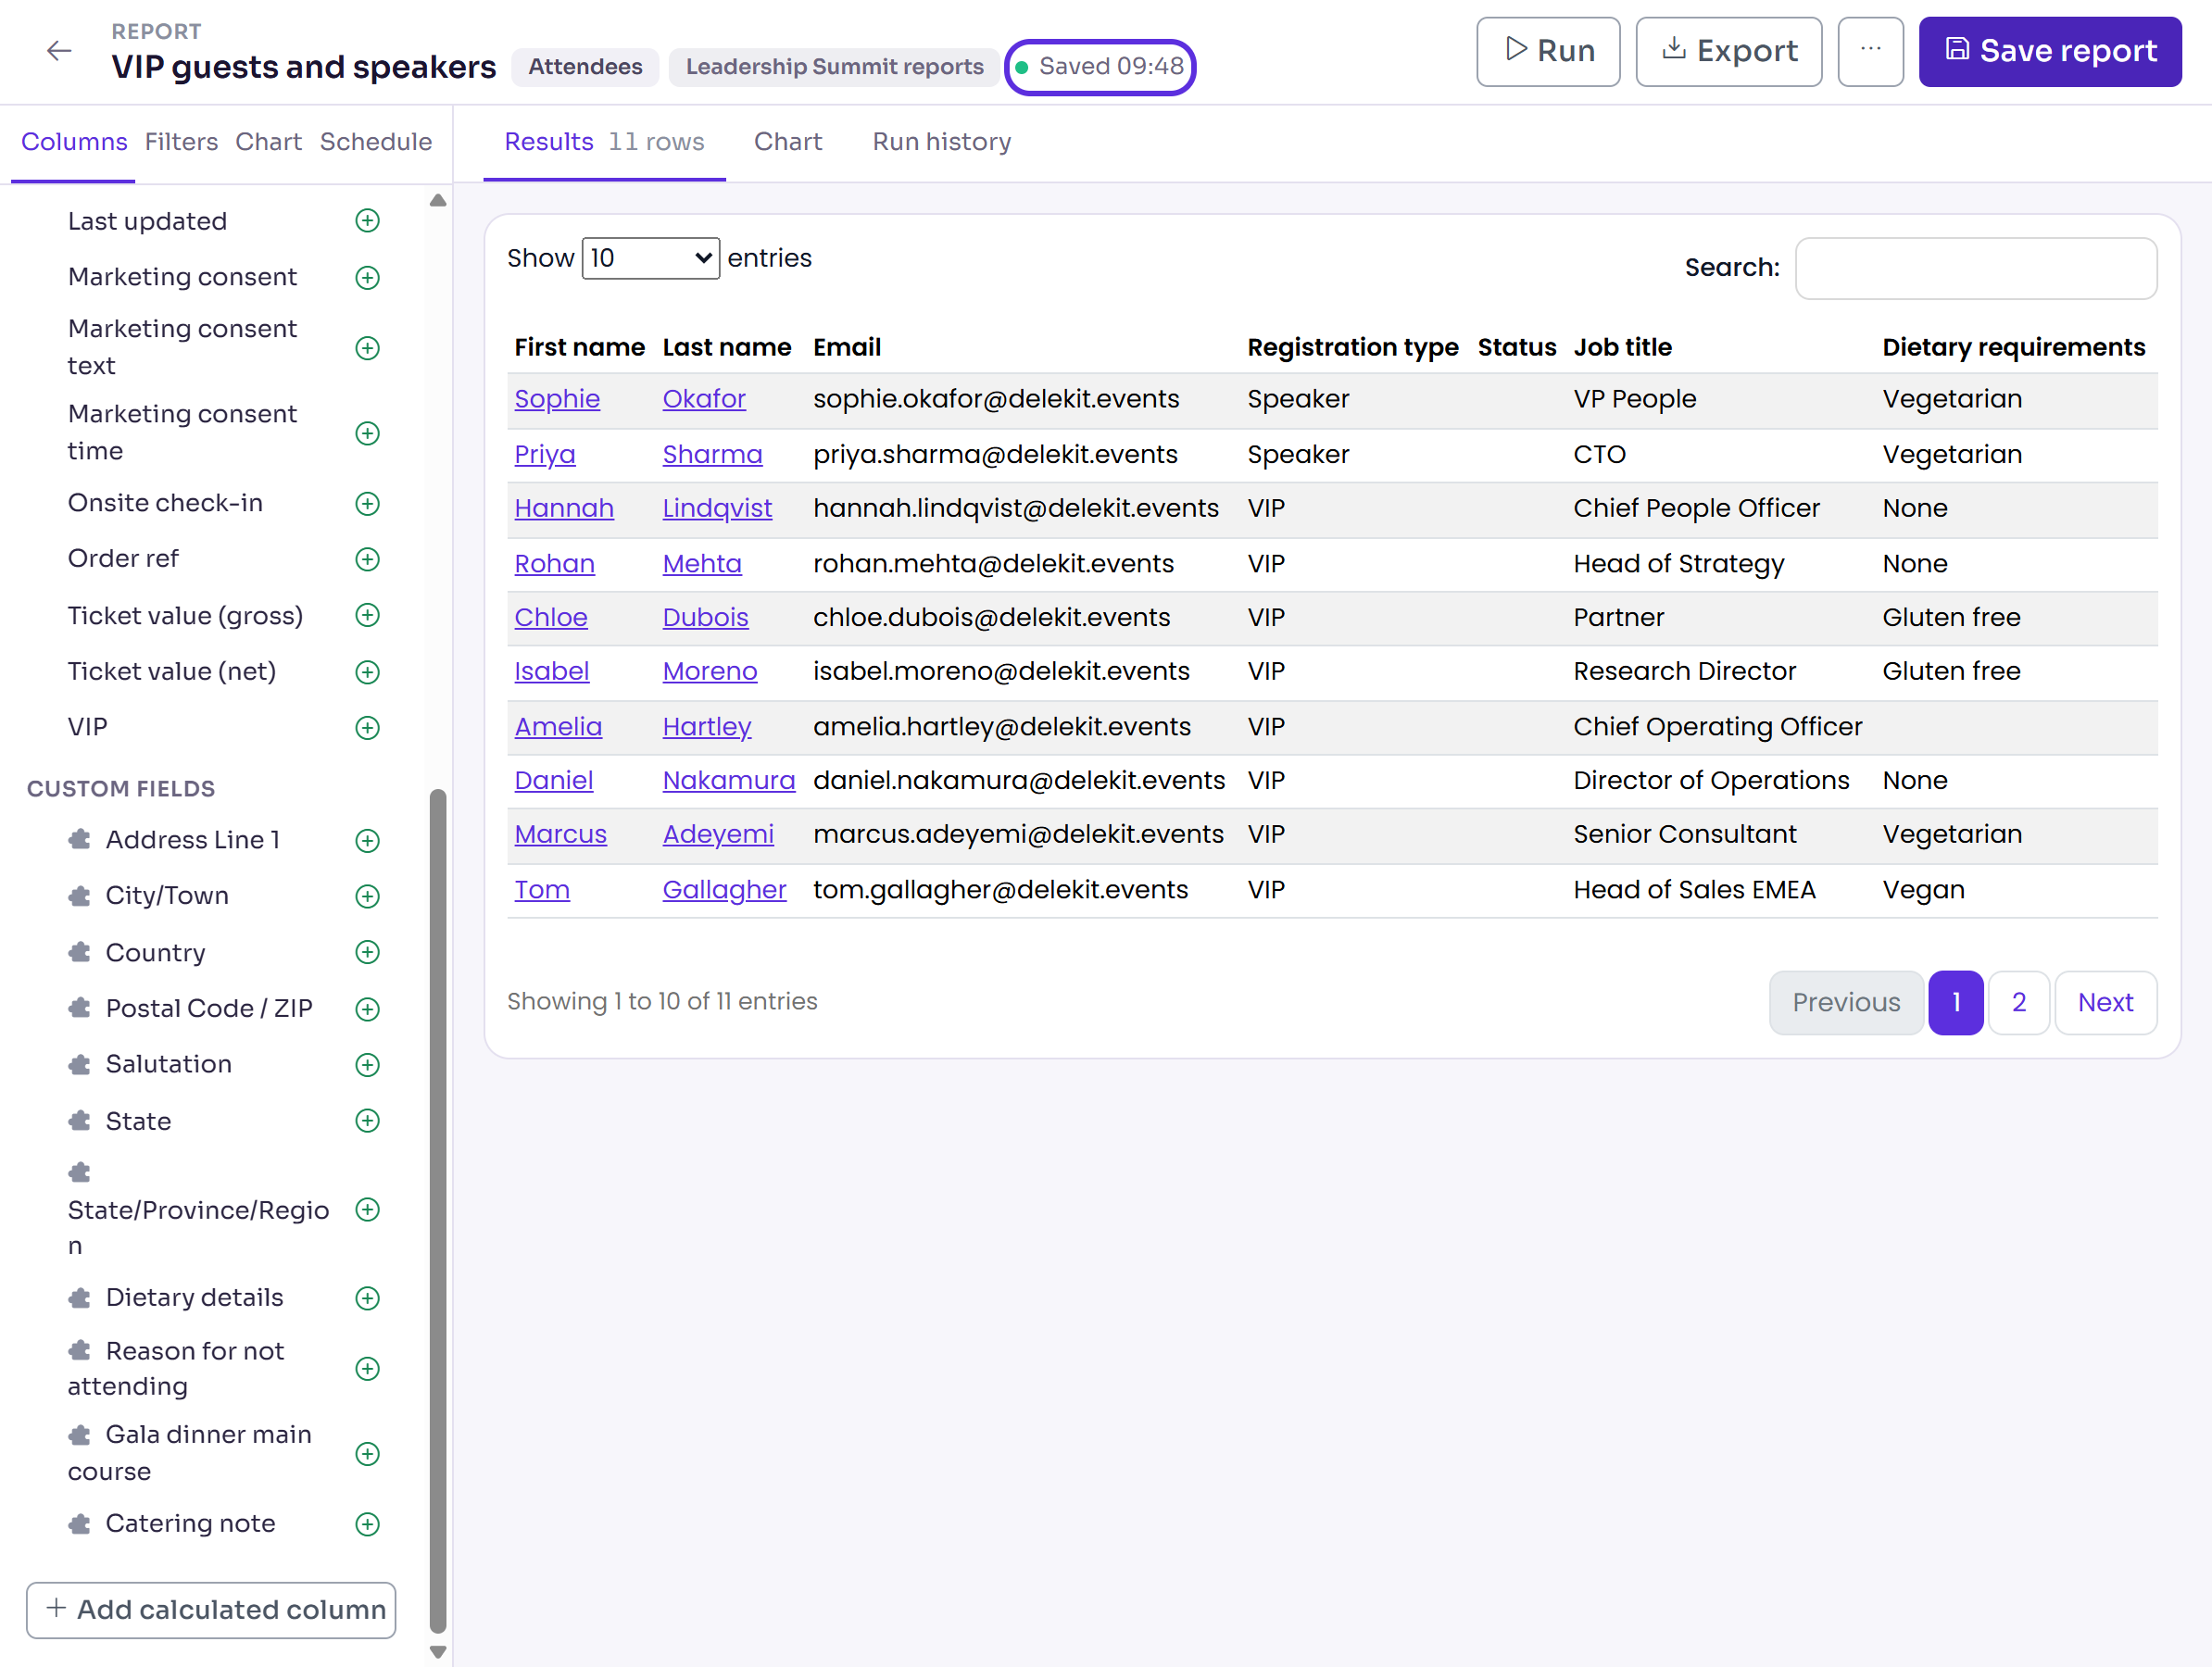
Select Save report. Next to the report's name, you see Saved and the time.
To change the order, drag a column by its handle. To take one out, select the − next to it. Select all adds every field. Select Run at any time to refresh the preview.
What happens next
- The report is on the Reports list, with its folder, data source, who created it and when. Select its name, or View, to open it again.
- The preview shows 10 rows at a time, with the number of rows next to Results. Names link to the attendee's record, which opens in a new tab.
- Test attendees are left out until you turn on Include test attendees on the Filters tab. Deleted attendees are never in a report.
- Nothing is sent to anyone. To share the report, export it or schedule it.
Check it works
Select Back to reports and open the report from the list. Its columns are as you saved them, and the preview shows the event's current data.
If something isn't right
- "Choose at least one field in the Columns tab before saving." Add a column, then save again.
- "Unsaved changes" next to the report's name: select Save report. If you try to leave the builder first, your browser asks before it goes.
- A column you expected isn't listed: each data source has its own fields. Custom fields are only in Attendees and Session attendance reports.
- A report tagged Our library or Delekit is a standard report, read-only in your event. To change it, select Save as new report and change the copy. See Organise, copy and delete reports.
Related articles
- Filter, sort, group and chart a report
- Export a report to Excel or CSV
- Schedule a report by email
- Organise, copy and delete reports
- Add custom fields to your event
Still stuck? Contact Delekit support.
Was this article helpful?
That’s Great!
Thank you for your feedback
Sorry! We couldn't be helpful
Thank you for your feedback
Feedback sent
We appreciate your effort and will try to fix the article